As a data scientist deeply invested in uncovering the narratives hidden within data, I recently embarked on an intriguing project focused on mixed-effect models. This blog post will walk you through my experience, the insights gained, and the broader implications for fields such as marketing and business.
Introduction: Mixed Effect Models Project
This project revolves around understanding and applying mixed-effect models to a simplified dataset. Mixed effect models are particularly useful for analyzing data with multiple levels of variability, making them a powerful tool in data science.
Simplified Dataset: Dataset Overview
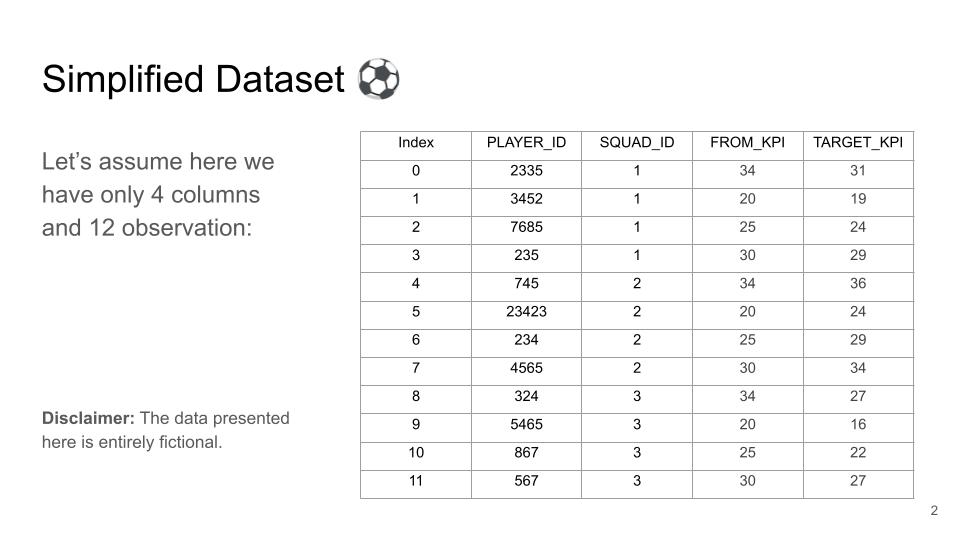
The dataset used in this project includes four columns: PLAYER_ID, SQUAD_ID, FROM_KPI, and TARGET_KPI, with twelve observations. This fictional dataset is designed to simulate performance metrics tracked over time for different squads, akin to real-world scenarios in marketing and business where data is segmented by regions or customer groups.
Initial Visualization: Visualizing the Data
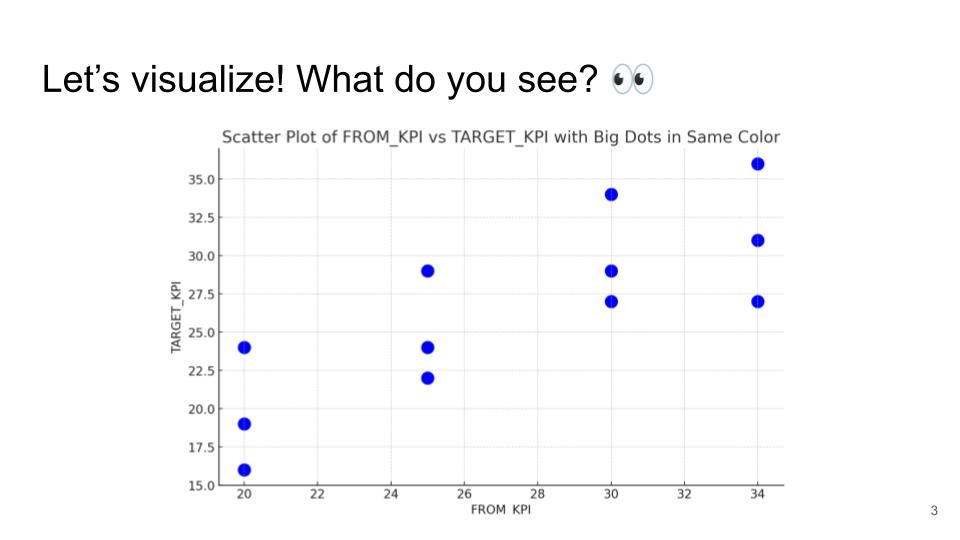
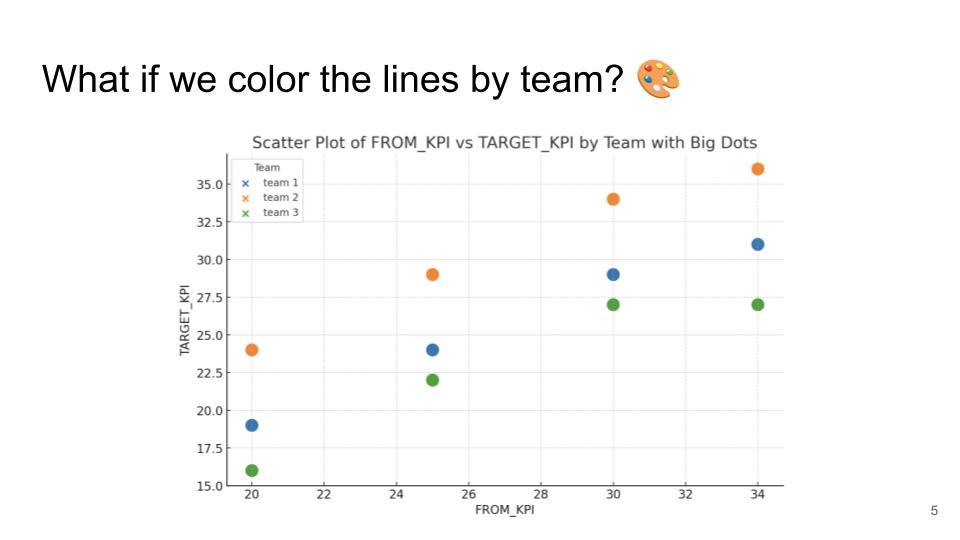
The first step in any data analysis project is visualization. By plotting FROM_KPI against TARGET_KPI and using different colors for each squad, we can easily identify patterns and trends. This visualization serves as a foundation for more in-depth analysis.
Simple Linear Regression: Fitting a Linear Model
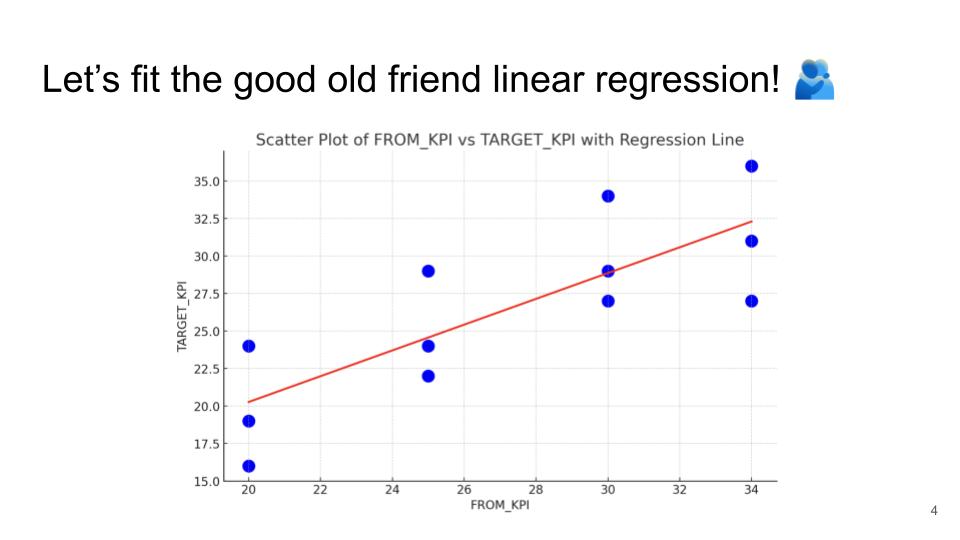
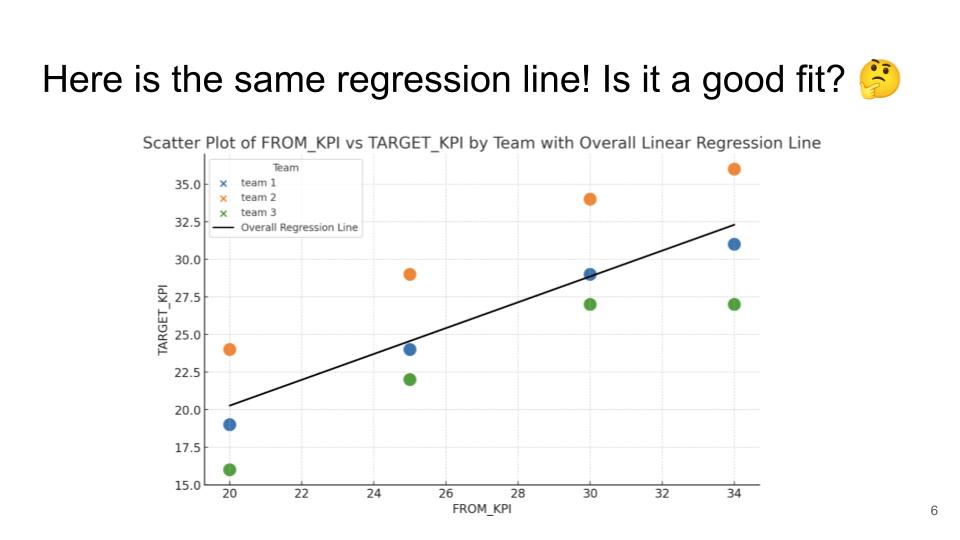
Starting with a simple linear regression model helps us understand the basic relationship between FROM_KPI and TARGET_KPI. However, this model does not account for the hierarchical structure of the data, such as variations between different squads. In a business context, this is akin to analyzing overall sales trends without considering regional differences.
Adding Color by Team: Highlighting Group Differences
By coloring the regression lines according to the squad, we can better visualize how each group behaves differently. This step highlights the importance of considering group-specific variations, which are critical in fields like marketing where customer segments may respond differently to campaigns.
Evaluating the Fit: Assessing Model Fit
The same regression line applied across all squads shows whether the initial model is a good fit. Often, a single line fails to capture the nuances of each group’s data, indicating the need for a more complex model.
Mixed Effect Models: Introducing Mixed Effect Models
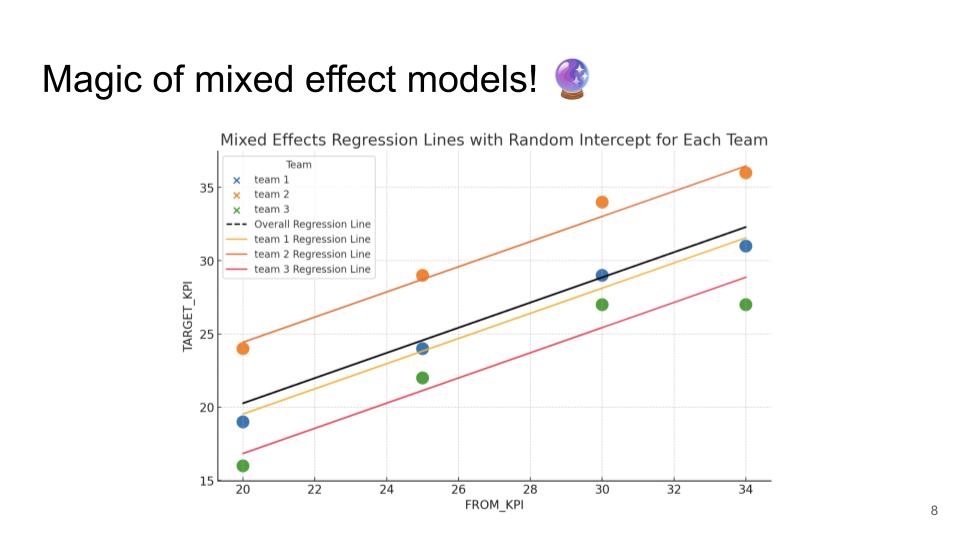
Mixed effect models come into play to address the limitations of simple linear regression. By incorporating both fixed effects (common to all observations) and random effects (specific to groups), these models provide a more accurate and nuanced understanding of the data.
Random Intercepts: Enhancing with Random Intercepts
Adding random intercepts allows the baseline performance to vary across squads. This adjustment better captures the inherent differences between groups, making the model more reflective of real-world scenarios where different regions or customer segments have unique starting points.
Random Slopes: Incorporating Random Slopes
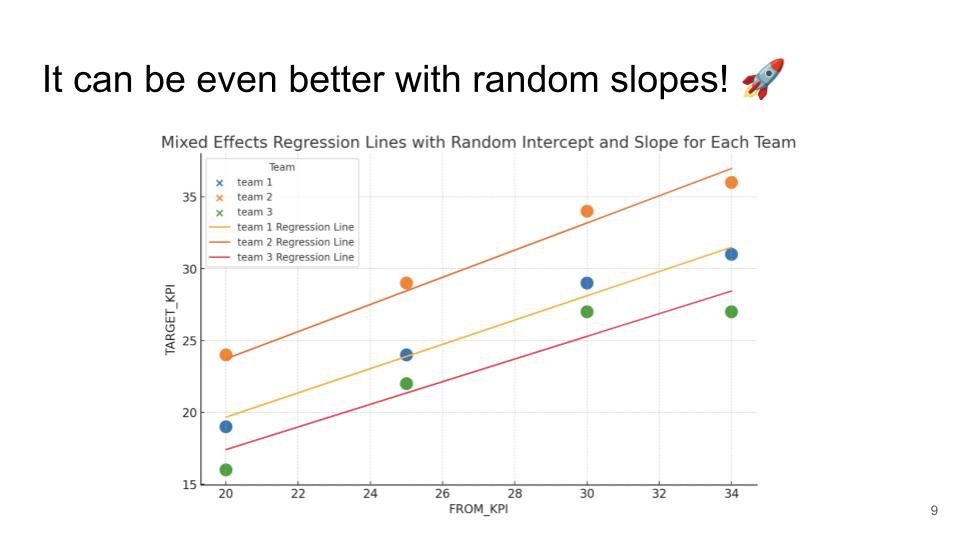
To further refine the analysis, random slopes are introduced. This addition allows the relationship between FROM_KPI and TARGET_KPI to vary across different squads, capturing even more of the underlying complexity. In business terms, this could be compared to understanding how different factors influence sales performance in various regions, allowing for more targeted and effective interventions.
Comprehensive Model: Bringing It All Together
The final model, with both random intercepts and slopes, offers a comprehensive view of the data. This approach uncovers deeper insights and allows for more informed decision-making, crucial for optimizing marketing strategies and business operations.
Real-World Implications
The insights gained from this project have broad applications in both marketing and business. By using mixed-effect models, companies can gain a deeper understanding of their data, uncovering patterns and trends that might be missed with simpler models. This can lead to more informed decision-making, better resource allocation, and ultimately, improved performance and profitability.
For instance, a marketing team could use these models to assess the effectiveness of different campaigns across various customer segments. By understanding which strategies work best for which groups, they can optimize their efforts, increase customer engagement, and drive higher conversion rates.
Conclusion
Working on this project has been a rewarding experience, deepening my understanding of mixed-effect models and their applications. These models offer powerful tools for analyzing complex data, providing insights that can drive better business outcomes.
I encourage you to explore the full presentation [here]. For more about my journey and other projects, feel free to connect with me on [LinkedIn].
Thank you for joining me on this exploration of mixed-effect models. I look forward to sharing more insights and experiences in future posts.

