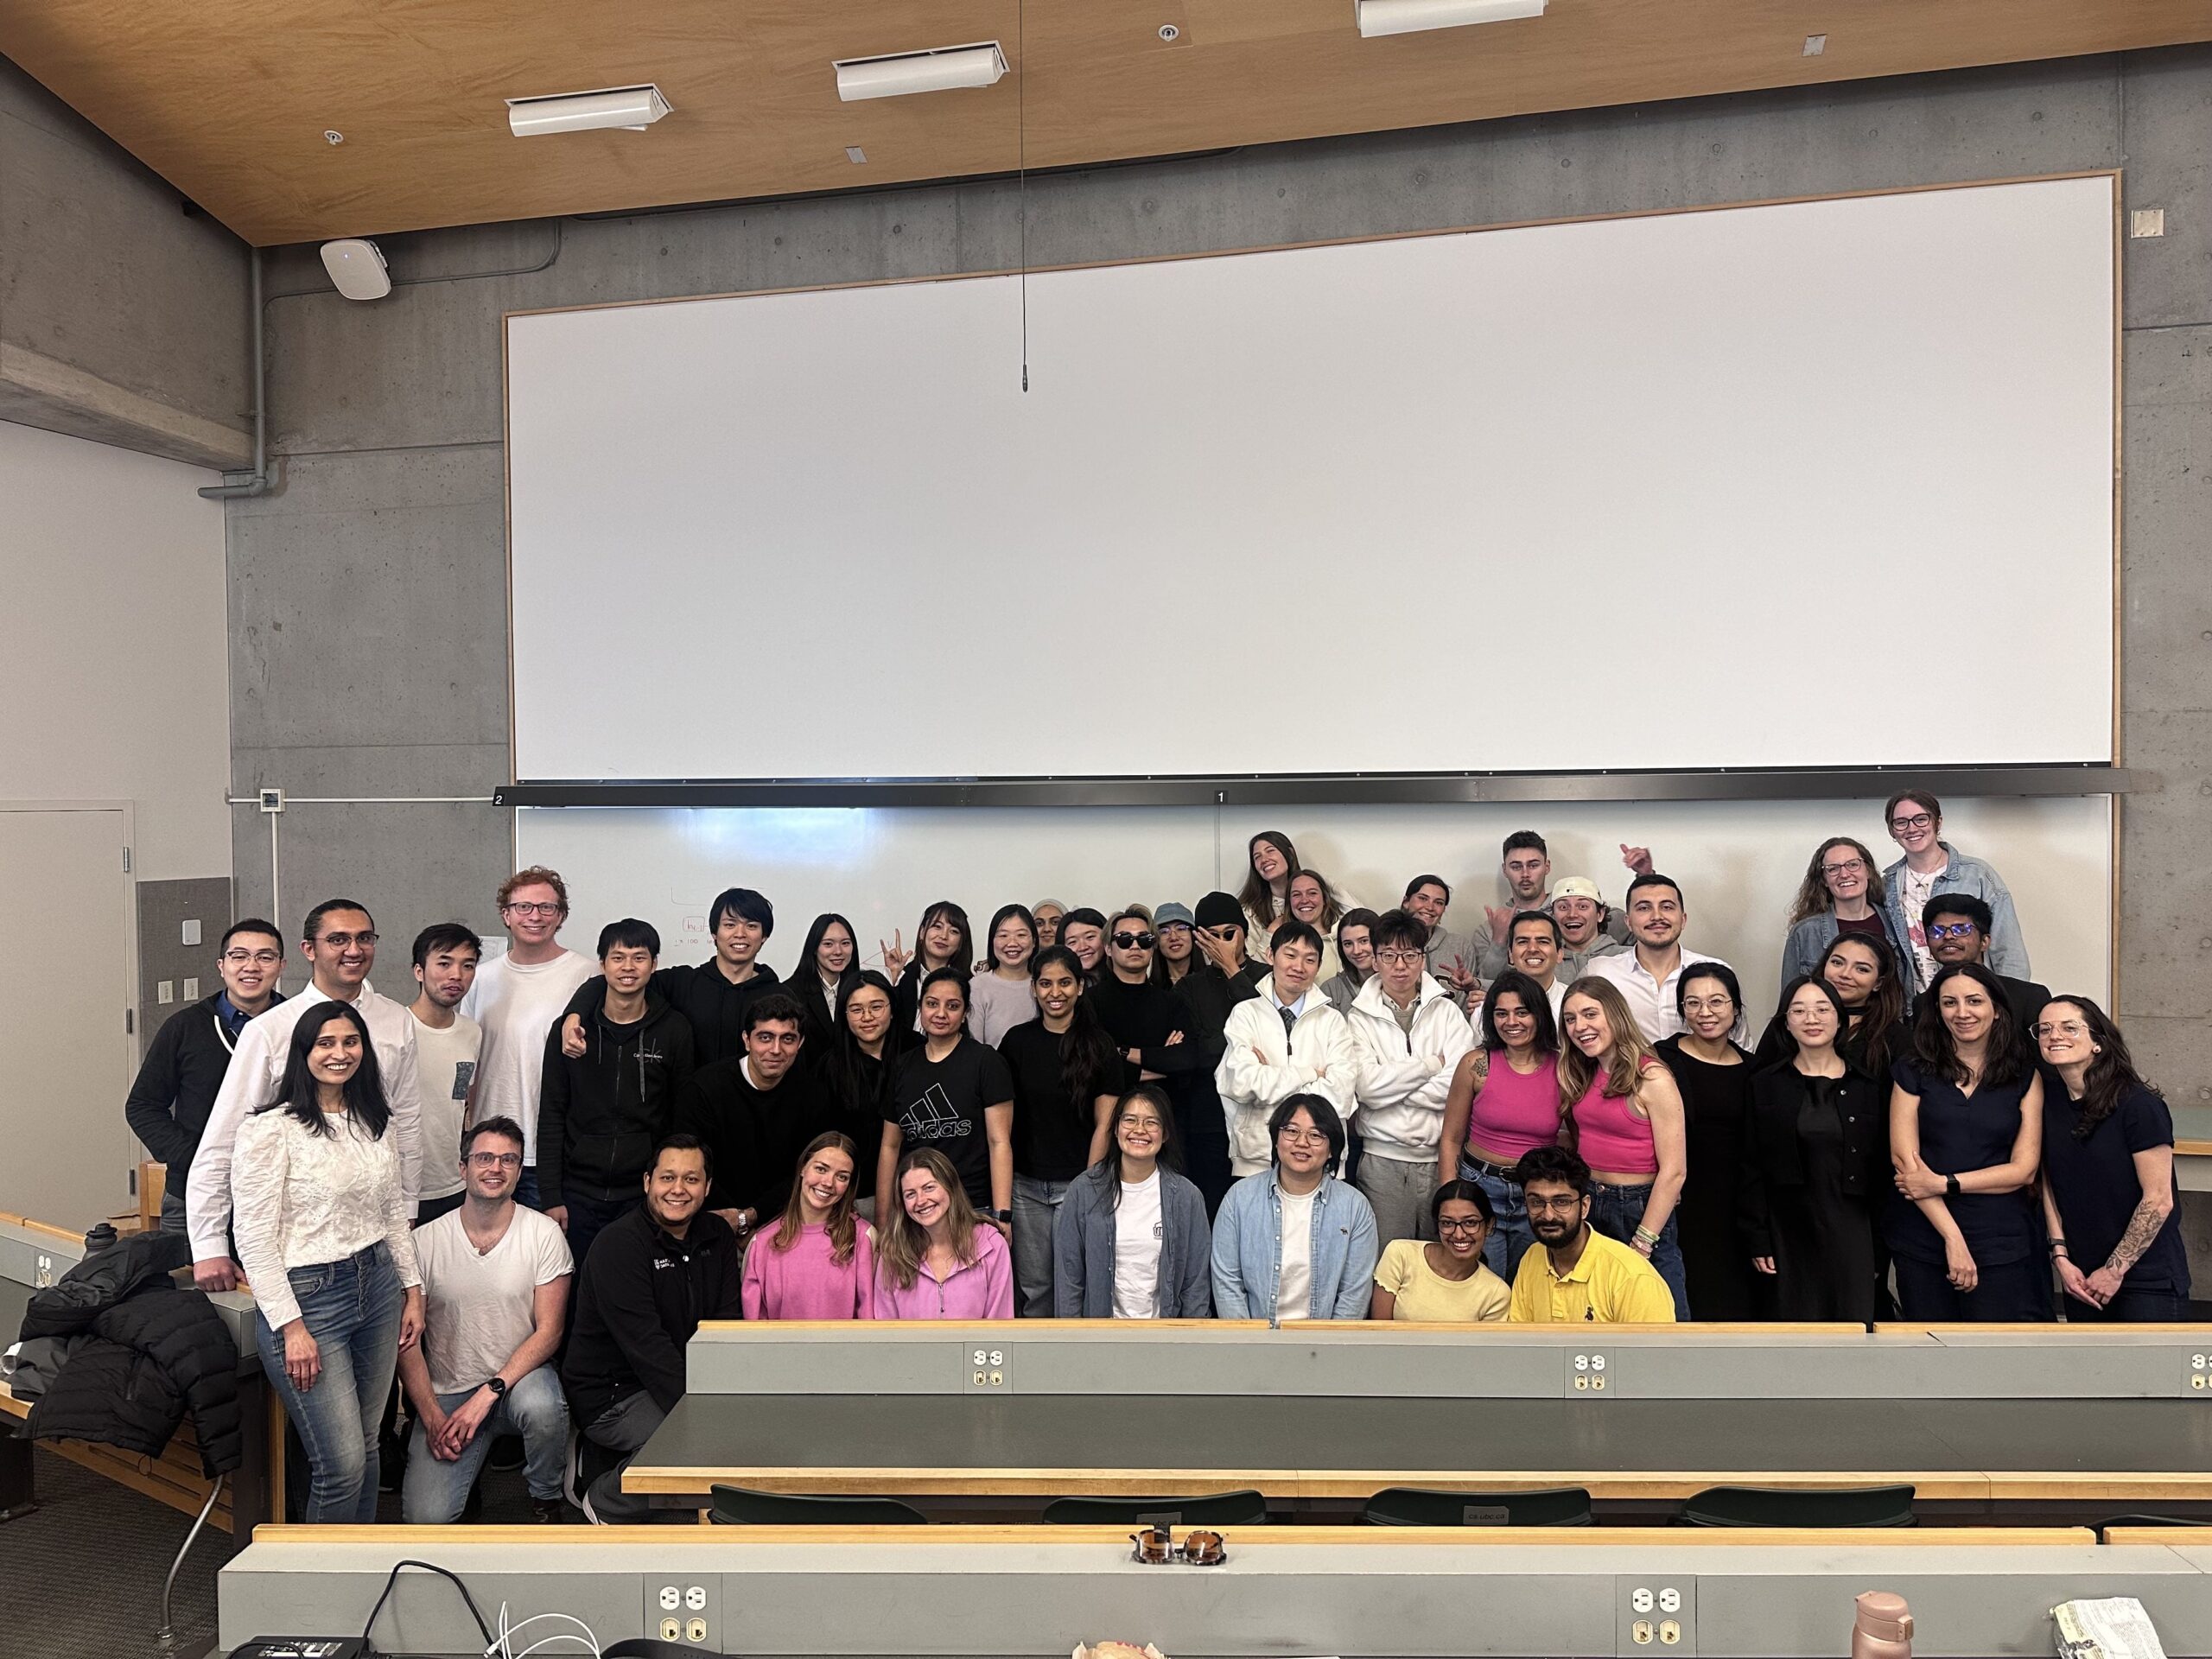
Embarking on the Master of Data Science journey at the University of British Columbia has been one of the most transformative experiences of my professional life. Block 6, in particular, was not just insightful but also incredibly fun, filled with collaborative projects and memorable moments. One of the highlights was our Pairs Day, and here’s a photo from one of our last days together—capturing the camaraderie and joy we shared as we wrapped up this amazing journey. Whether you’re a data enthusiast, marketing expert, or an entrepreneur curious about how data science can shape your business, there’s something here for you.
DSCI 553: Statistical Inference and Computation II
Block 6 kicked off with Statistical Inference and Computation II, which turned out to be a deep dive into advanced statistical concepts and practical computation methods. It wasn’t just about learning the theory; it was about applying those methods to real-world datasets to make sense of uncertainty and variability—something that resonates with my work in digital marketing. One of my favorite projects was implementing Bayesian methods to analyze campaign performance for a client. By leveraging these methods, I was able to quantify the effectiveness of different marketing channels. The ability to quantify uncertainties in a data-driven decision process has now become an invaluable tool for optimizing marketing funnels and enhancing overall campaign strategy.
Takeaway Tip: If you’re managing campaigns or products, think about incorporating statistical inference to understand trends and variability better. For instance, using Bayesian analysis can give you insights into how likely your next marketing strategy will yield results.
DSCI 575: Advanced Machine Learning
The real magic of Block 6 happened in Advanced Machine Learning. Here, we moved from foundational machine learning models to more sophisticated and scalable approaches. We covered essential techniques like boosting, bagging, and ensemble learning, as well as hyperparameter tuning for optimizing model performance. When you’re trying to optimize multiple ad channels simultaneously, ensemble methods provide a powerful framework for achieving stability and better prediction accuracy. We also tackled interpretability, using tools like SHAP to understand model predictions—something every data science professional in marketing should pay close attention to.
Personal Insight: One case study I loved working on involved applying Random Forests to a customer churn dataset. As someone who’s built marketing funnels and analyzed customer retention, understanding how different features contributed to churn was a game-changer.
DSCI 532: Data Visualization II
What’s the point of discovering amazing insights if you can’t communicate them effectively? Data Visualization II pushed us to explore visual storytelling, taking complex datasets and making them accessible. This aligns perfectly with my experience as a CMO for Bookapo, where turning dry statistics into engaging visuals for stakeholders became essential. One specific project I worked on during the course involved visualizing a dataset on language learning progress over time, using Tableau to create an interactive dashboard that tracked learners’ improvements across different skill sets. Another project I worked on was creating an interactive dashboard titled ‘All The Unicorns Around The World,’ which visualized data on unicorn startups globally. This Tableau dashboard allowed users to filter by country, explore different industries, and view the total valuation and distribution of unicorns. It was an excellent opportunity to blend my data storytelling skills with my knowledge of global startup trends, making complex data both engaging and accessible. This project not only honed my data storytelling skills but also provided insights into how to present key metrics in a compelling way to drive engagement. Throughout the course, I honed my skills using tools like ggplot2 and Tableau and I found myself appreciating the delicate balance between simplicity and impact.
Example: Imagine presenting your customer segmentation results to an investor. Using clear and compelling visualizations can mean the difference between securing additional funding and leaving stakeholders confused.
DSCI 542: Communication and Argumentation
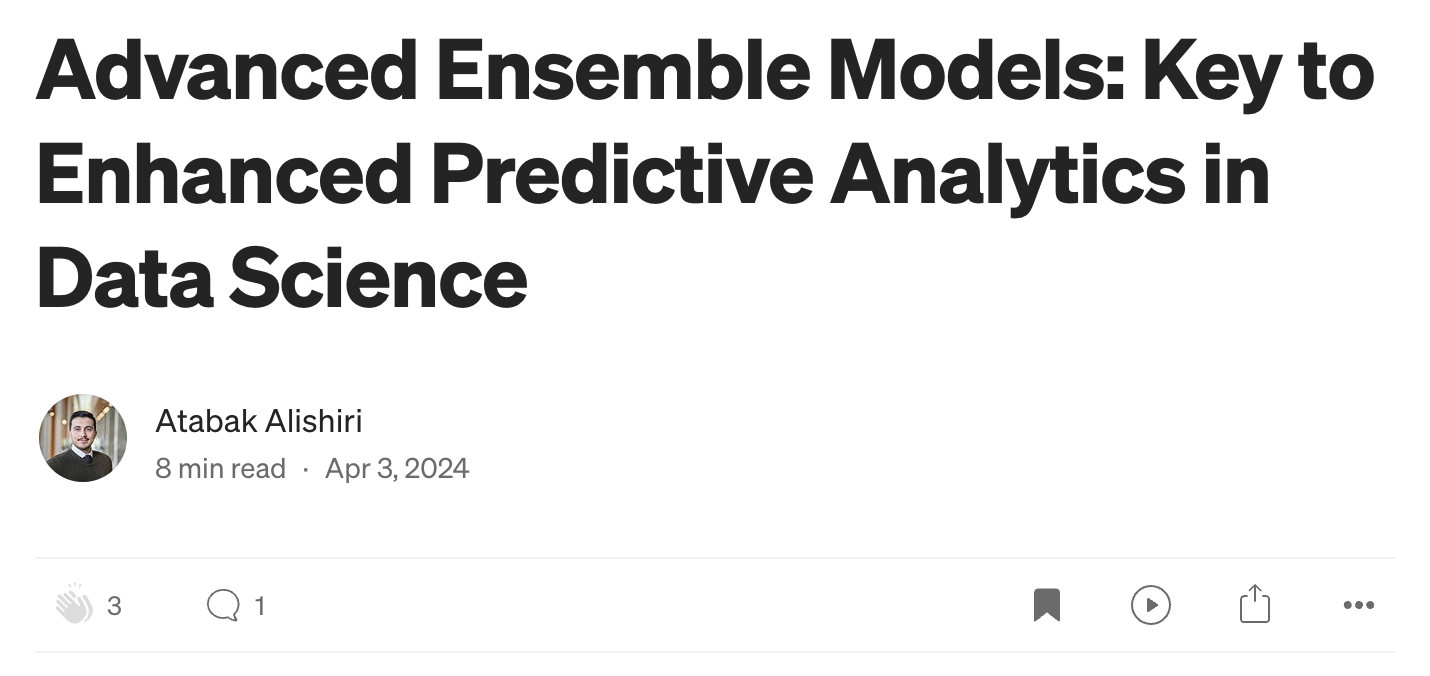
Lastly, Communication and Argumentation emphasized the importance of effectively communicating complex data insights to diverse audiences. This course taught us how to construct arguments and present data-backed findings convincingly. One project that stood out involved preparing a presentation for a non-technical audience on the impact of machine learning models on customer retention. Additionally, I wrote a blog post titled ‘Navigating the Ensemble: A Deep Dive into Advanced Ensemble Learning Techniques,’ which was published on Medium. This post allowed me to explore and communicate advanced machine learning concepts, such as boosting and bagging, in an accessible way to a broader audience, enhancing both my technical understanding and my ability to articulate complex topics clearly. This experience taught me how to distill complex technical content into simple, impactful messages that resonate with stakeholders, an essential skill in both data science and business.
Pro Tip: When presenting complex data, consider the audience’s level of understanding. Tailor your message to be both accessible and informative. A well-structured argument, supported by data-driven insights, can bridge the gap between technical content and business needs, ensuring your stakeholders fully grasp the impact of your findings.
Bringing It All Together: A Mindset Shift
Block 6 wasn’t just a series of courses; it was an experience that cemented the idea that data science is more than just building models—it’s about understanding the data, deriving meaningful insights, and communicating those insights in a way that drives action. From building Bayesian models to predict campaign success, to leveraging advanced machine learning techniques for customer retention analysis, and creating interactive visualizations to tell compelling data stories, I’ve transitioned from learning to applying these skills in real-world scenarios. As someone with a background in entrepreneurship and digital marketing, I’ve seen firsthand how these skills can change the course of a product’s development or a company’s strategy.
The mix of rigorous coursework, hands-on projects, and the opportunity to relate it all back to my professional endeavors has made Block 6 unforgettable. It’s given me new tools to approach business problems and has shown me the profound impact that well-executed data science can have in the real world.
Ready to Unlock the Power of Data?
Block 6 has been a transformative journey that highlighted the interconnectedness of statistical methods, machine learning, data visualization, and communications. It’s not just about building models; it’s about deriving actionable insights, preparing data effectively, and telling compelling stories that drive meaningful change. The experiences and lessons from these courses have deepened my understanding and equipped me with tools to tackle complex challenges in both marketing and entrepreneurship.
Remember, the power of data lies not just in the analysis, but in the story you tell and the actions you take.


